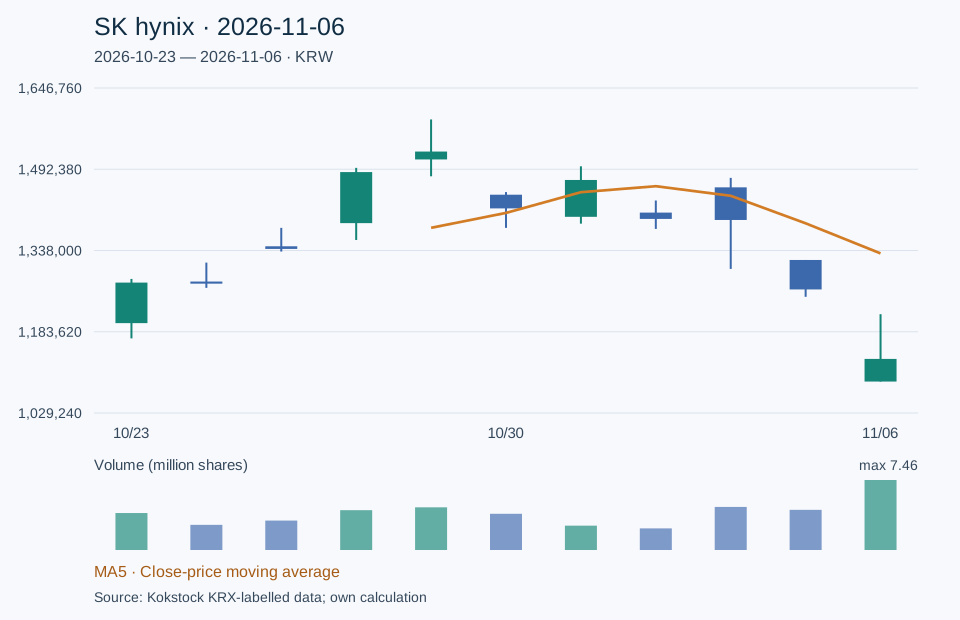
When a stock drops sharply on heavy volume, it is tempting to say that someone stepped in to absorb the selling. SK hynix's November 6 chart invited that interpretation. I checked where trading ended before giving the volume a story.
The November 6, 2026 KRX close was KRW 1,132,000, down 10.44%. Hankyung's quote page showed about KRW 8.58 trillion in trading value. That explains the choice of an actively traded stock; it is not a ranking of likely future winners.
Key points
- SK hynix closed November 6 at KRW 1,132,000, down 10.44%.
- Volume was about 2.12 times the preceding five-session mean, which does not establish accumulation or a bottom.
- Conditional readings use the KRW 1,217,000–1,250,000 gap and KRW 1,089,000 low.
Scroll horizontally to read chart details
Higher than the open, still below Thursday's range
| Observation | Value |
|---|---|
| Open and low | KRW 1,089,000 |
| High / close | KRW 1,217,000 / 1,132,000 |
| Five-session average including November 6 | KRW 1,332,400 |
| Change from October 30 close | -20.17% |
The open was the low and the close finished above it. But the close was below the day's high, and that high remained below Thursday's KRW 1,250,000 low. An unfilled downside gap of KRW 1,217,000–1,250,000 remained. I read this as a partial recovery from the opening shock that failed to regain the previous trading range.
This is a short-window observation. Eleven bars do not establish a long-term bottom, double bottom or head-and-shoulders pattern. A pattern name is less useful than checking whether its required history and confirmation are present.
What 2.12 times normal volume does—and does not—show
The same provider reported about 7.46 million shares, approximately 2.12 times the preceding five-session average. Participation was higher. Volume alone cannot reveal buyers' motives or establish that selling pressure is exhausted.
I would watch whether the increased activity leads to price recovery. A close above KRW 1,250,000 followed by that area holding on a pullback would support an easing-pressure interpretation. A close below KRW 1,089,000 would weaken the November 6 stabilization scenario. Brief intraday touches and sustained closing levels should not be treated alike.
Business demand and the market price tell different parts of the story
SK hynix's October 28 release described expanding HBM4 and high-value server-product sales, and long-term agreements covering over half of 2027–2028 production capacity. These are company statements, not guarantees that forecast contracts, profits or share-price gains will materialize. Official SK hynix release
The results explain the business; the chart records the price investors assigned to it. Reading only one makes it easy to choose a conclusion too quickly. For this snapshot, recovery of the gap and stability of the low are more useful follow-up questions than a claim that heavy volume alone marks a bottom.
Checked November 7, 2026, KST. Naver stock history was excluded because its closing values differed from KRX closing reports. No local adjustment was made to the 11-session source prices; the provider's historical adjustment method is unspecified. No 20/60-session analysis is claimed. Volume consistently uses one provider's cumulative figures. General public-data commentary, not personalized investment advice.