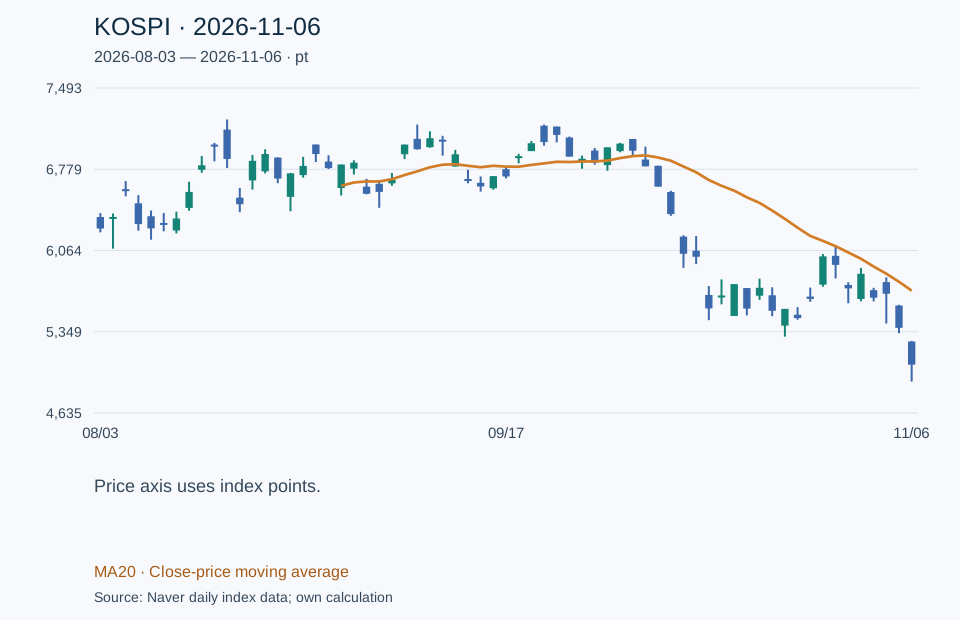
KOSPI closed above 5,000, but the daily chart told a less comfortable story. It fell as low as 4,911.28 during the session. Even Friday's high remained below Thursday's low. Holding a round number was one fact; ending a downtrend would require more evidence.
This review uses completed daily bars through November 6, 2026. The interpretation is editorial analysis, not a prediction that the next session must follow a particular direction.
Key points
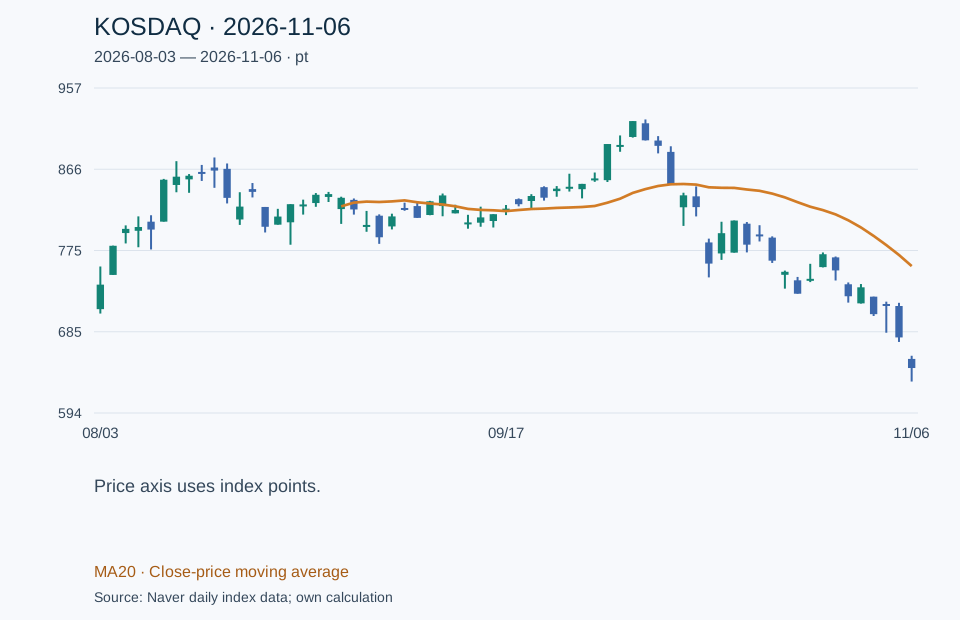
- KOSPI closed November 6 at 5,059.69 and KOSDAQ at 644.27.
- Both retained downside gaps; an intraday bounce is distinct from a recovered trend.
- 65 completed daily bars, MA20 and explicit conditions for reassessing the lows and gaps.
KOSDAQ fell less that day, but the week was still painful
| Index | November 6 close | Daily change | Change from October 30 |
|---|---|---|---|
| KOSPI | 5,059.69 | -6.02% | -11.71% |
| KOSDAQ | 644.27 | -5.03% | -11.06% |
KOSDAQ's smaller one-day decline does not establish that money rotated into smaller companies. Both indices lost more than 11% over the week. Closing levels and daily changes were cross-checked against reporting citing Korea Exchange; weekly returns were calculated from Naver's daily index data.
Scroll horizontally to read chart details
An unfilled downside gap, rather than a confirmed bottom
KOSPI's November 5 low was 5,336.88; its November 6 high was only 5,269.10. That empty interval is a daily downside gap. KOSDAQ left a similar gap between 657.95 and 673.38. An intraday rebound did not reach the previous session's range.
Scroll horizontally to read chart details
The 20-session closing averages were approximately 5,710.75 for KOSPI and 758.07 for KOSDAQ. Both ended below those averages. My reading is a period for watching the response to a sharp fall, rather than a confirmed bottom. A gap is an area to watch on a recovery; it does not have to be filled and is not an automatic trading signal.
Three different developments to watch
| Subsequent price action | Interpretation |
|---|---|
| A close below the November 6 low | Weakens the stabilization scenario: 4,911.28 for KOSPI and 629.17 for KOSDAQ |
| Lows hold, but rebounds stop below the gap | A technical rebound is possible; trend recovery remains unconfirmed |
| Closes recover the gap's upper boundary and hold later | More evidence of easing short-term selling pressure; a renewed break of the low would require reassessment |
A large bounce alone can be misleading after a large fall. I would also watch whether recovered levels hold in later sessions and whether gains spread beyond a handful of large stocks. The next session has not happened, so its outcome is absent from this analysis.
Checked November 7, 2026, KST. Source OHLC values are used without filling holidays. MA20 begins only when 20 sessions are available. This is general market commentary, not advice tailored to an individual's holdings or finances.