A sharply lower share price and an up candle can coexist. Samsung Electronics opened November 6 at KRW 180,000 and closed at KRW 188,700. That was above the open, but still 6.35% below the previous close of KRW 201,500. Candle color and daily return answer different questions.
This article examines 11 completed KRX-labelled daily bars from October 23 through November 6, 2026. Samsung was selected as an actively traded stock: Hankyung's quote page showed approximately KRW 6.35 trillion in trading value. Heavy trading is not a reason, on its own, to buy.
Key points
- Samsung rose from its open but closed 6.35% below the previous session: an up candle can coexist with a daily loss.
- The KRW 196,500–199,800 gap and KRW 179,200 low define the observation areas.
- Only 11 KRX-labelled sessions were used; ambiguously scoped quotes were excluded.
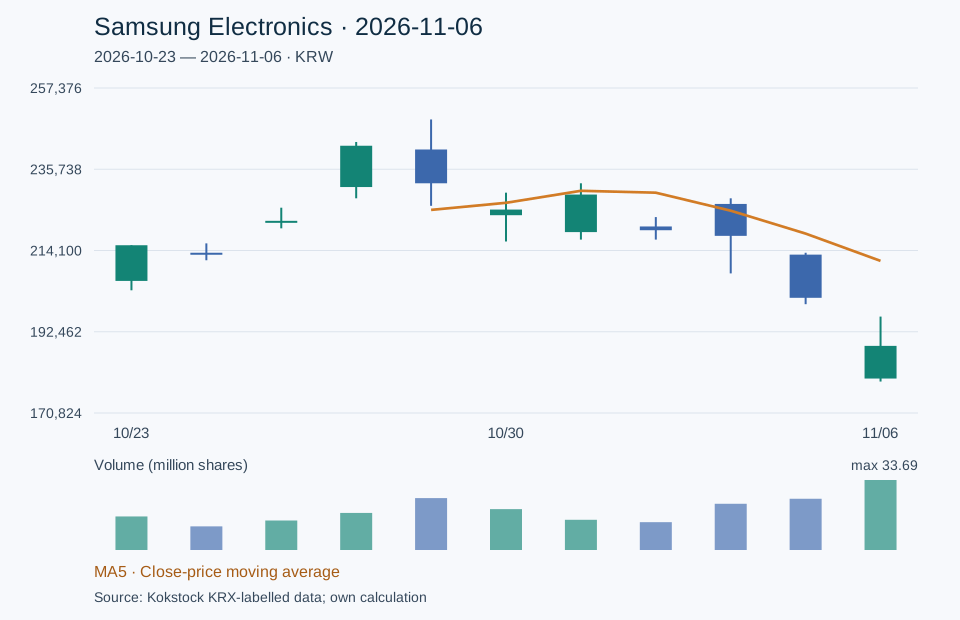
Scroll horizontally to read chart details
The rebound never reached Thursday's trading range
| Observation | Value |
|---|---|
| November 6 open / close | KRW 180,000 / 188,700 |
| Low / high | KRW 179,200 / 196,500 |
| Five-session average including November 6 | KRW 211,340 |
| Change from October 30 close | -16.13% |
Friday's high of KRW 196,500 remained below Thursday's low of KRW 199,800. My description is a gap down followed by a recovery from the open. The KRW 196,500–199,800 downside gap remained unfilled, so one up candle did not confirm a reversal. That observed interval is more specific than treating the round KRW 200,000 level as inherently decisive.
The same provider reported approximately 33.69 million shares, about 1.78 times the preceding five-session average. Turnover increased, but every trade has a buyer and seller. The number alone cannot prove accumulation by large investors.
Strong reported earnings do not settle tomorrow's price
Samsung's October 29 results release described record memory-business performance and expanding AI-related products. Those are the company's reported operating developments. How much the market will pay for future results is a separate question. Samsung's official release
I would frame the chart around recovery of the gap, rather than assume a fall makes a rebound inevitable. A close above KRW 199,800 followed by continued holding would add evidence of easing pressure. A close below KRW 179,200 would weaken the scenario that November 6 marked a stable low. These are conditions for revising an interpretation, not target prices or order instructions.
Check the trading window when quotes disagree
Naver's daily data displayed KRW 193,500 during research, differing from KRX closing reports. That stock series was excluded. Mixing closing prices and volumes from differently scoped screens could change a calculated pattern. An unexplained value was not patched into the series.
Checked November 7, 2026, KST. Eleven bars are insufficient here for claims about 20/60-session averages or long-term patterns. The source does not state its historical corporate-action adjustment method, so this is not described as adjusted-price analysis. Final cumulative volume differs slightly across capture times; every volume calculation consistently uses Kokstock. General public-data commentary, not personalized investment advice.